An official website of the United States government
Here's how you know
Official websites use .gov
A
.gov website belongs to an official
government organization in the United States.
Secure .gov websites use HTTPS
A lock (
) or https:// means you've safely
connected to the .gov website. Share sensitive
information only on official, secure websites.
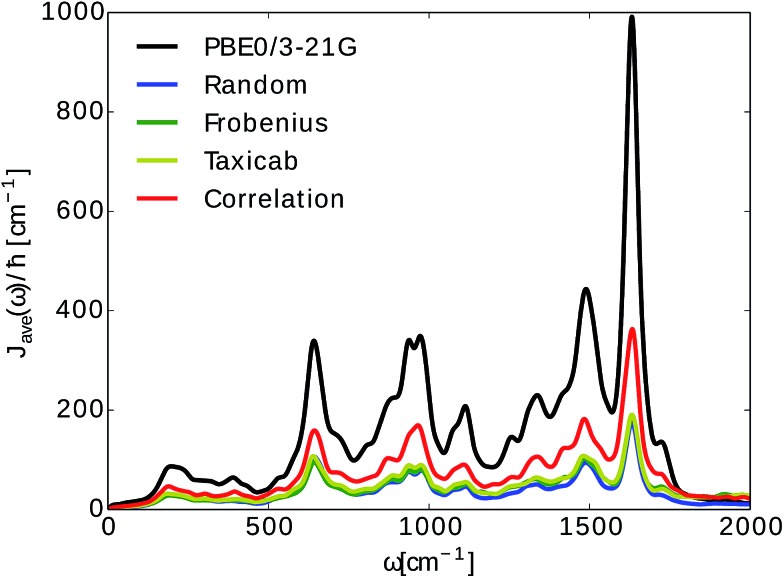
 . The spectral densities were computed from excited state energy trajectories obtained from TDDFT calculations (PBE0/3-21G) and compared to spectral densities from neural network predicted excited state energy trajectories. Neural networks were trained on the bacteriochlorophyll they predicted with the indicated Coulomb matrix selection method. The correlation method (see Section 2.2.3) gives the best prediction.