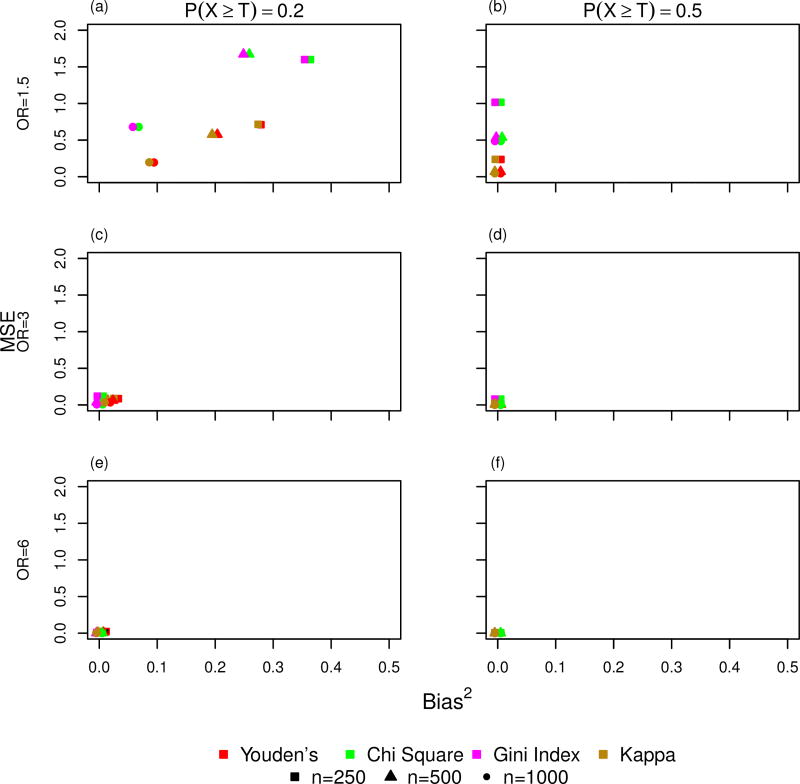
Figure 3.
Simulation results showing mean-squared error (MSE) by Bias2 under the case-control study design for the estimated threshold obtained by maximizing the statistics: Youden’s, chi-square, Gini Index, and kappa, excluding P(X ≥ T)=0.05. Rows represent strength of association between X and Y and columns represent the probability that the independent variable X is greater than the true threshold T.

