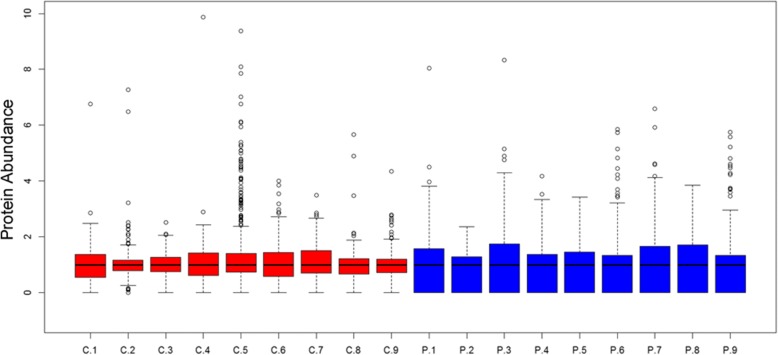
Fig. 1.
A boxplot produced by R version 3.4.1 about all proteins in each sample. C1 is short for the number 1 sample in the control group while P1 represents the number 1 sample in the proliferative diabetic retinopathy group. The results demonstrate a wider protein distribution in PDR samples than those in IMH vitreous. Furthers, more proteins in the control group have abnormal abundance and C5 is the most unreliable.

