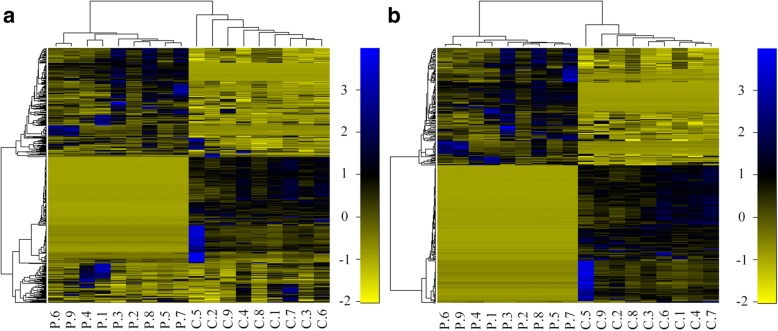
Fig. 4.
Hierarchical clustering analysis (HCA) by R version 3.4.1. a HCA of all proteins. b HCA of significant proteins. The color gradient illustrates the fold change of protein abundance between the two groups. A clear separation of the protein expression in the two disease states is shown and the separation becomes more apparent when significant proteins been taken into account

