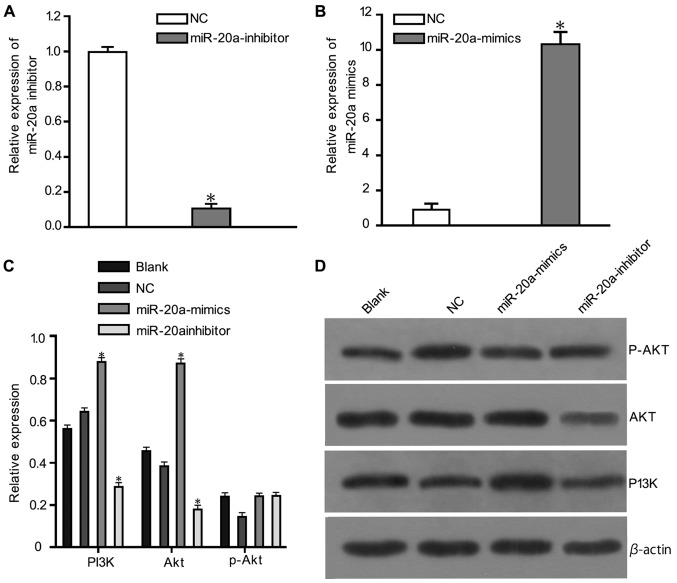
Figure 4.
The relative expression of miR-20a, inhibitor, and protein levels of PTEN, PI3K, Akt and p-Akt detected by western blotting. (A) The relative expression of miR-20a inhibitor. (B) The relative expression of miR-20a. (C) Diagram of the protein bands in each group detected by western blotting. (D) Histogram of the protein expression levels in each group; *P<0.05 compared with the blank and NC groups. NC, negative control; PTEN, phosphatase and tensin homolog; PI3K, phosphoinositide 3-kinase; AKT, protein kinase B; p-Akt, phosphorylated Akt.

