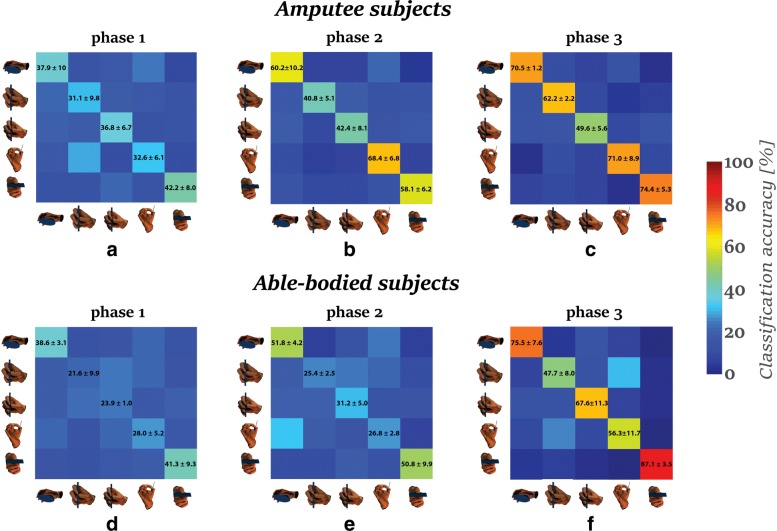
Fig. 4.
The confusion matrices for all the motion phases (phases 1, 2 and 3). The confusion matrices present the average classification accuracies and their standard deviations for the five grasp types. The matrices on the top correspond to the classification performances among the amputee subjects while the matrices on the bottom correspond to the classification performance of the able-bodied subjects. The horizontal axis of the confusion matrices correspond to the predictions while the vertical axis correspond to the ground-truth. The color of the tile was assigned according to the colormap of the classification accuracy on the right. The grasp types are represented by the corresponding figures as it is shown in Fig. 1

