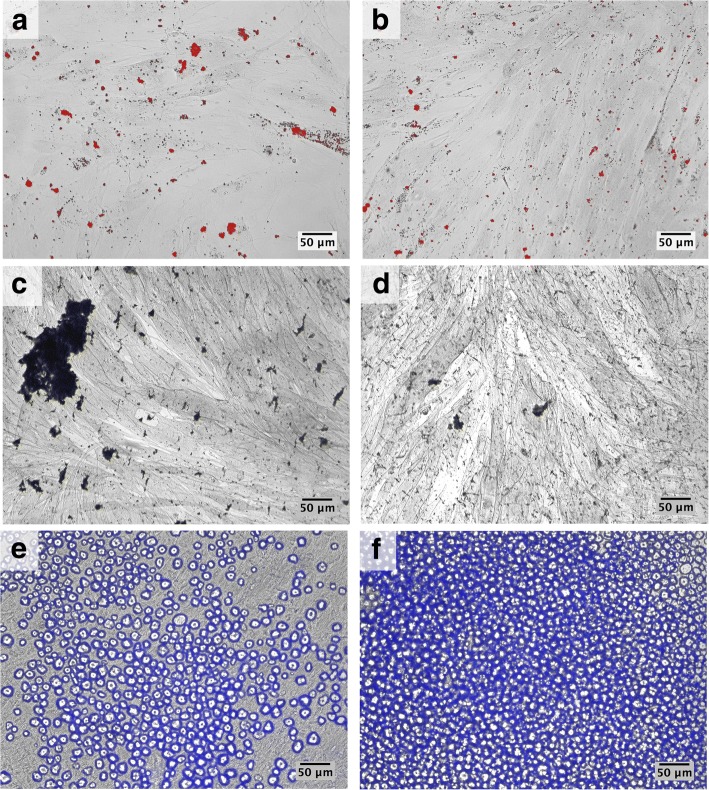
Fig. 2.
DPSCs were induced to differentiate towards adipogenic, osteogenic, and chondrogenic lineages in a 2D culture. Phase-contrast microscopy. a-b: Oil Red O staining shows lipids deposits in red after 21 days of adipogenic differentiation. c-d: von Kossa staining identifies calcium deposits at the end of osteogenic protocol. e-f: Alcian blue staining shows the presence of GAGs. A, C, E: CT12. B, D, F: NF87

