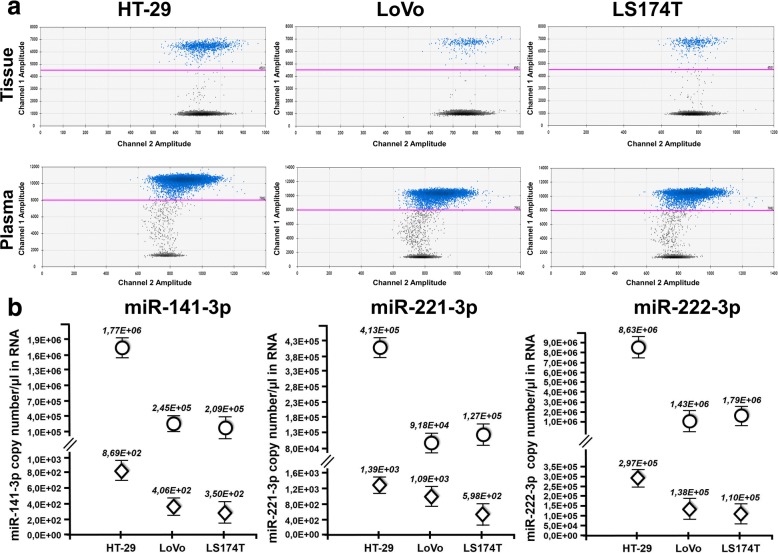
Fig. 4.
RT-ddPCR analysis of miRNA expression in tumor xenografts and plasma. Tumor tissue and blood plasma were obtained from three mice, and miRNAs were quantitated by RT-ddPCR. (a) 2D ddPCR plot of miR-222-3p in tumor tissues (upper) and plasma (lower). 2D ddPCR plots were from 1:100 diluted samples for optimal Poisson distribution. (b) ddPCR analysis of miR-141-3p, miR-221-3p and miR-222-3p from tumor tissue (dots) and plasma (diamonds). All data are expressed as copy/μL of miRNA from the original sample. Standard deviation was calculated from three independent experiments

