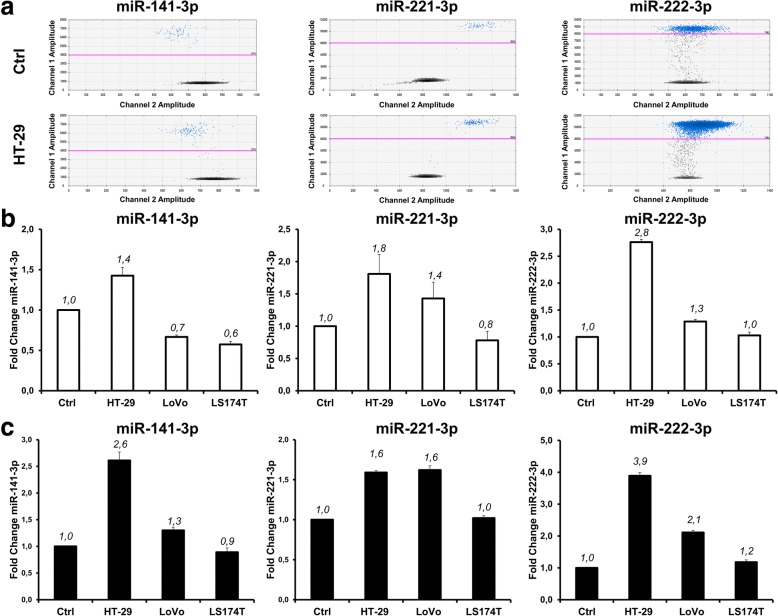
Fig. 5.
Comparative analysis of miRNA expression in plasma samples of xenotransplanted mice and tumor-free littermates. Plasma samples were analyzed by RT-ddPCR (a and b) and RT-qPCR (c). Panel a displays representative 2D ddPCR plots from tumor-free (top) and tumor xenotransplanted (bottom) mice. Panels b and c show miRNA ratios between xenotransplanted and tumor-free mice for the three miRNAs, as estimated by ddPCR and RT-qPCR, respectively

