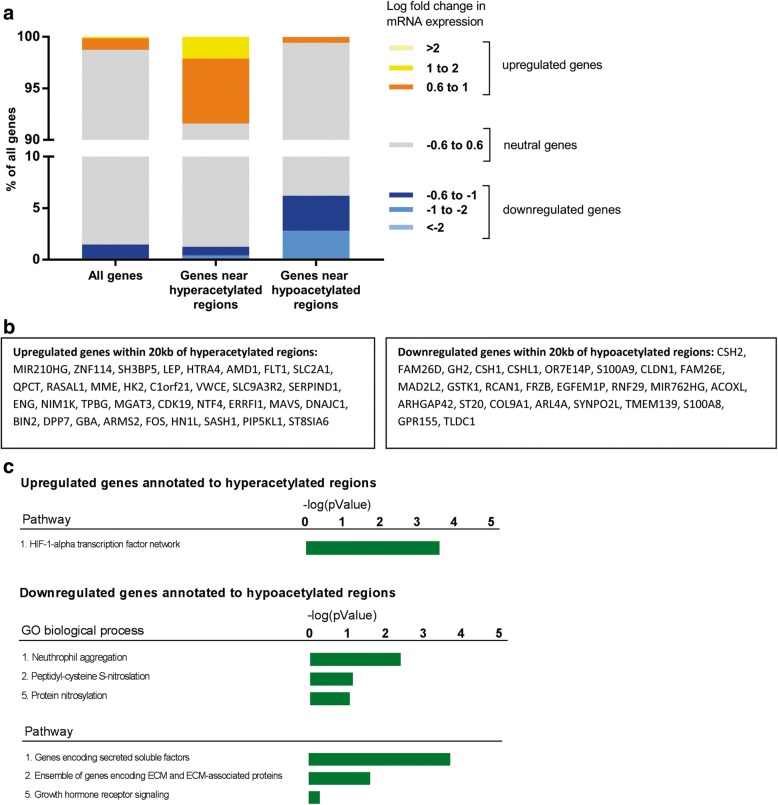
Fig. 4.
Combined analyses of CHIP-seq and RNA-seq. a Distribution of fold changes in gene expression near hyperacetylated and hypoacetylated regions. b Differentially transcribed genes detected by RNA-seq with a TSS within 20 kb of differentially acetylated regions and differentially regulated gene transcripts. c Identification of GO biological processes and pathways within genes overlapping in CHIP and RNA-seq regions using ToppFun

