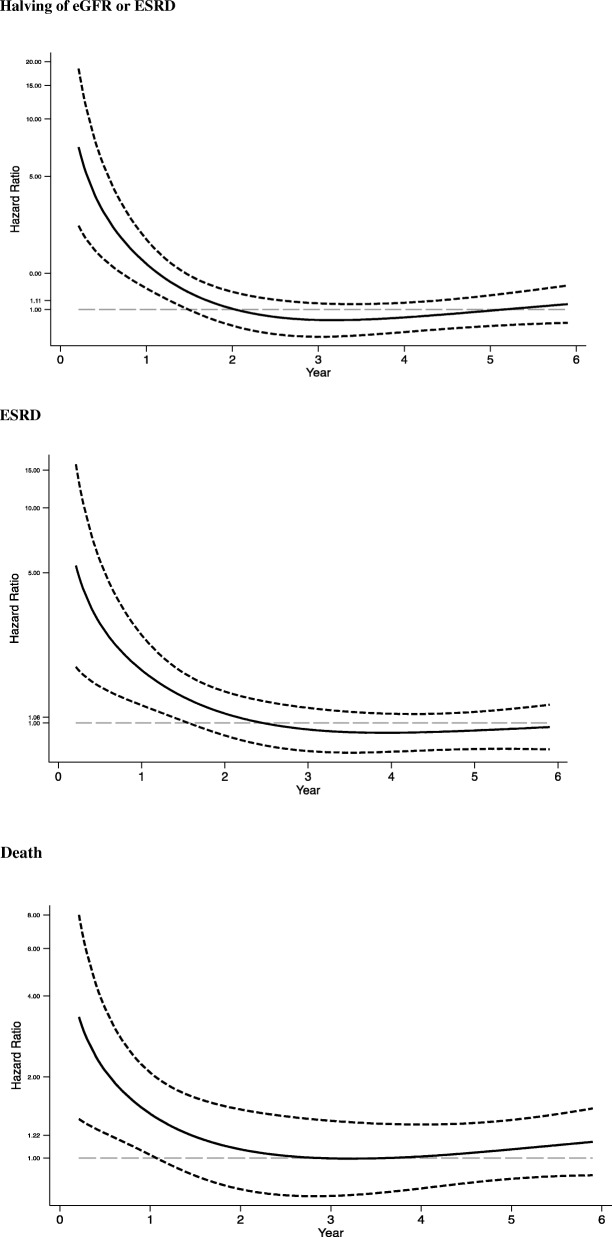
Fig. 1.
Time-varying Hazard Ratios for CKD progression and death for participants with hematuria compared to those without hematuria. Solid lines indicate the time-varying Hazard Ratios for participants with hematuria compared to those without hematuria for each of the three studied outcomes (Halving of eGFR or ESRD, ESRD, and death). Dashed lines indicate 95% confidence intervals. The natural logarithm of analysis time using restricted cubic splines transformation with 3 knots and its interaction with hematuria was applied to all models above. Model for Halving of eGFR/ESRD was adjusted for age, race, sex, education, eGFR, albuminuria, diabetes, systolic blood pressure, BMI, BNP, HbA1c, FGF23, albumin. Model for ESRD was adjusted for age, race, sex, education, eGFR, albuminuria, diabetes, systolic blood pressure, BMI, BNP, FGF23, serum albumin, high-sensitivity CRP. Model for Death was adjusted for age, race, sex, education, eGFR, albuminuria, diabetes, systolic blood pressure, ankle-brachial index, smoking, history of cardiovascular disease, BNP, troponinT, calcium, FGF23, high-sensitivity CRP

