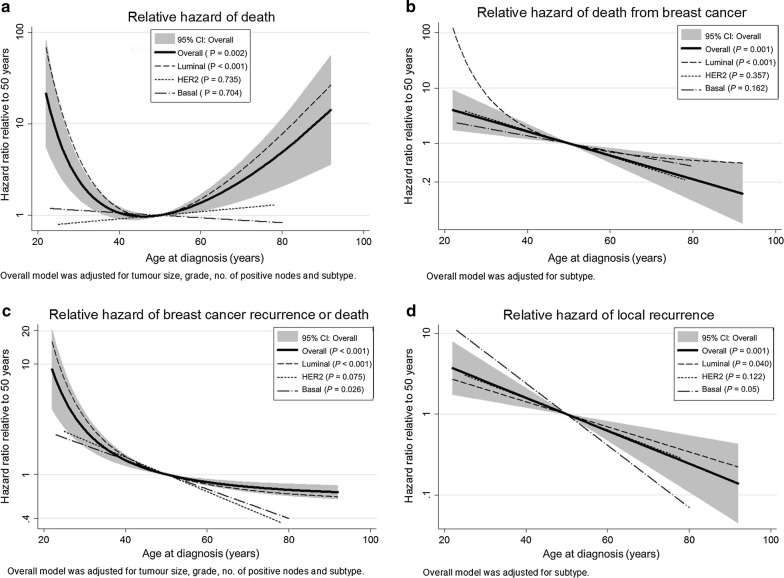
Fig. 2.
Plot for age at diagnosis and hazard ratio of over survival (a), breast cancer-specific survival (b), breast cancer-free interval (c), and breast cancer-free interval (d) with the baseline set at 50. Overall: Plot of hazard ratio of any deaths against age at diagnosis with the baseline set at age 50 for all histologic subtypes and 95% confidence interval (CI) shaded in gray. Separate plots for each histologic subtype, including luminal: estrogen receptor (ER) or progesterone receptor (ER) positive breast cancers; HER2: HER2 amplified or over-expressed breast cancers; and Basal: Triple-negative breast cancers superimposed

