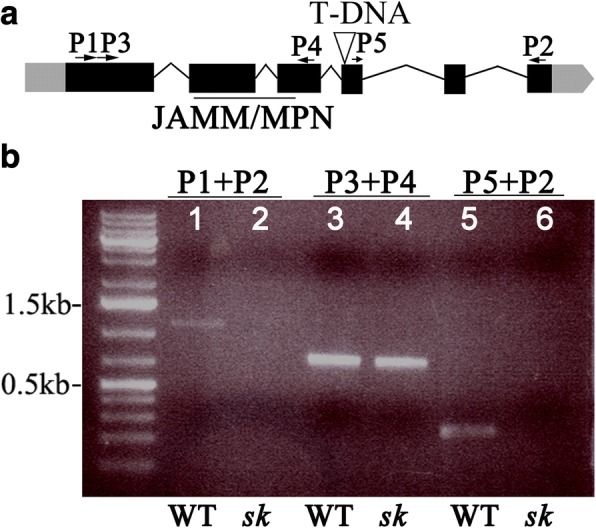
Fig. 4.

Molecular characterization of sk372. a Schematic representation of the CSN5a locus in sk372 showing T-DNA insertion and primer locations. UTRs and exons are indicated by the grey and black boxes, respectively and introns are represented by lines. The CSN5a JAMM/MPN domain is underlined; b CSN5a truncation analysis using cDNA as a template. Lanes 1 and 2, full length coding sequence (938 bp) of CSN5a in WT and sk372, respectively; Lanes 3 and 4, amplified fragment from 162 bp to 886 bp of in WT and sk372; Lanes 5 and 6, amplified fragment starting from bp 1034 to 3′ end in WT and sk372
