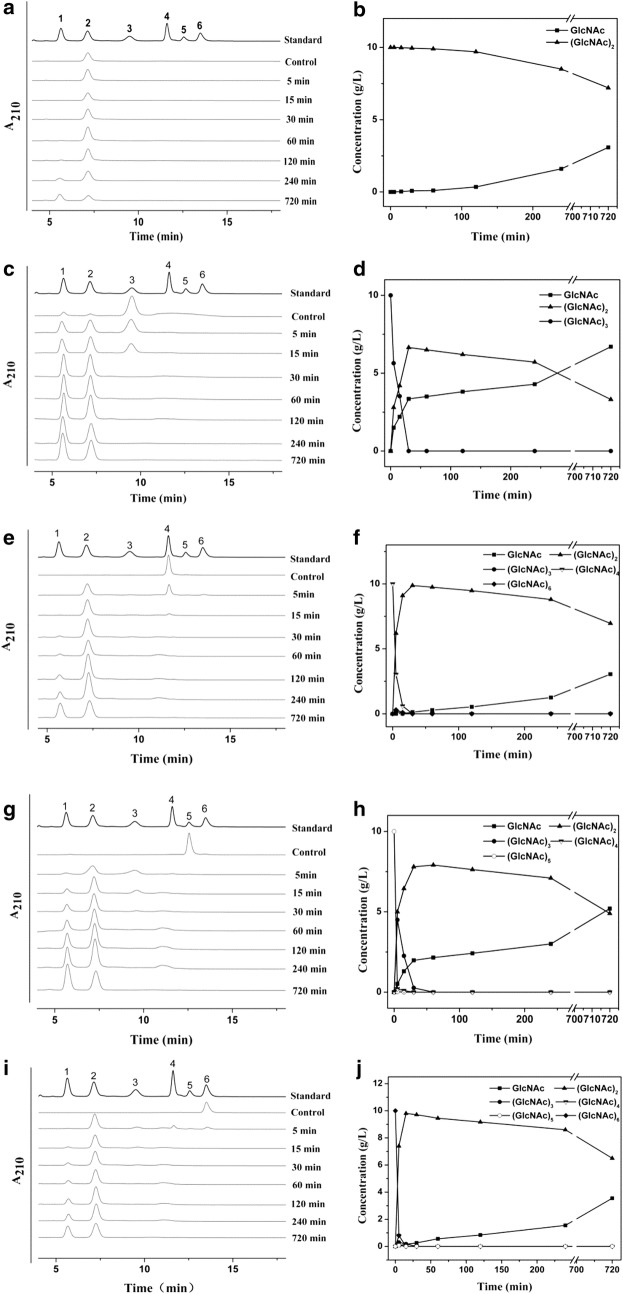
Fig. 6.
Cleavage pattern of (GlcNAc)2–6 by CmChi1. Numbers 1–6 represent GlcNAc to (GlcNAc)6. a, c, e, g, i show the hydrolysis products from (GlcNAc)2–6 using HPLC, respectively. b, d, f, h, j show the concentrations of CHOS products generated during the reaction time course from (GlcNAc)2–6, respectively

