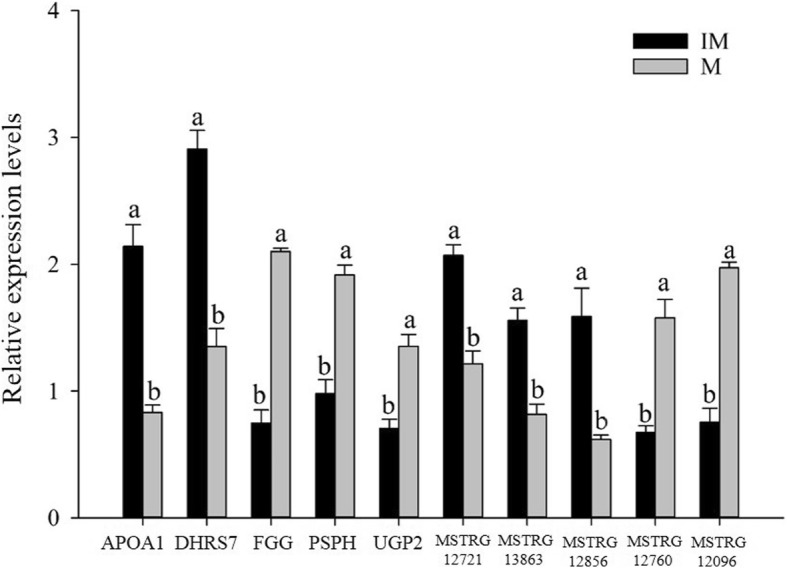
Fig. 3.

Five differentially expressed mRNAs and five differentially expressed lncRNAs, which were validated by reverse-transcription quantitative polymerase chain reaction. 1. IM represent the immature livers from one-day-old chickens, M represent the mature livers from adult chickens; 2. β-actin was used as an internal control gene for normalization in our experiments. The data were presented as means ± SE (for young chicks: n = 20; for adult chickens: n = 5). Upper letters (a, b) on bars denote significantly different expression levels in the same mRNAs or lncRNAs (P < 0.05)
