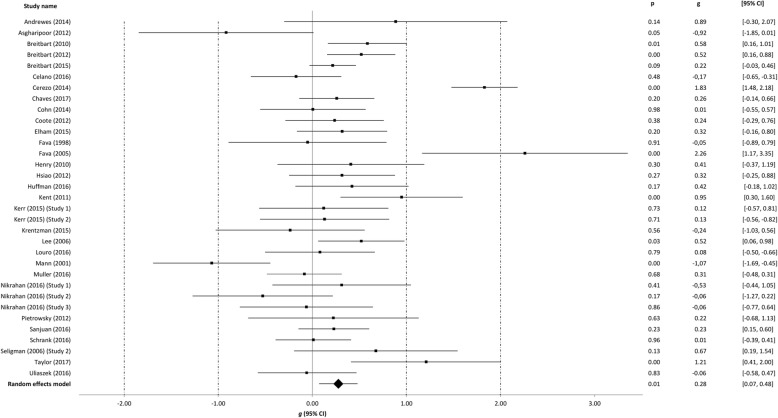
Fig. 2.
Post-intervention effects of positive psychology interventions on well-being. The square boxes show Hedges’ g effect size and sample size (the larger the box, the larger the sample size) in each study, and the line the 95% confidence interval. The diamond reflects the pooled effect size and the line the width of the 95% confidence interval

