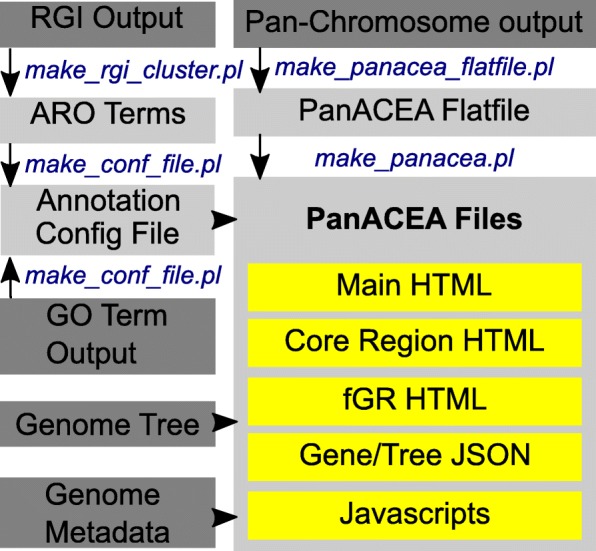
Fig. 1.

PanACEA Pipeline Flowchart. The PanACEA pipeline with the initial files shown in dark gray, the PanACEA PERL scripts shown in blue font, the resulting PanACEA intermediate files shown in light gray, and the final files shown in yellow. The final PanACEA output includes all the HTML pages, JSON files, and Javascripts scripts necessary to run the viewer. The RGI output referenced is generated by the RGI software package. Additional information on the requirements for the input files can be found in the user manual located on the GitHub page
