
Fig. 1.
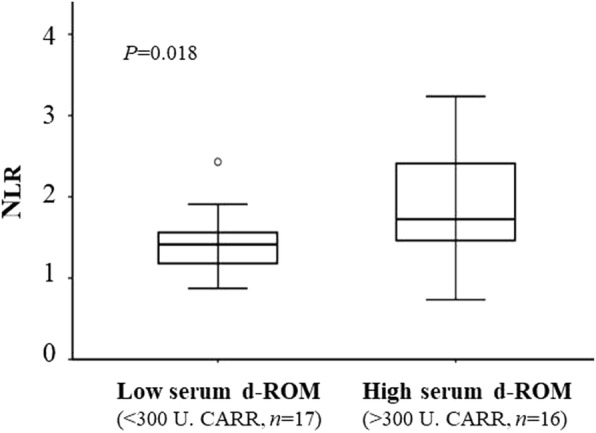
Distribution of NLR in individual patients with low and high serum d-ROM. Data are presented as upper and lower quartile range (box), median value (horizontal line), and middle 90% distribution (whisker line)
Official websites use .gov
A
.gov website belongs to an official
government organization in the United States.
Secure .gov websites use HTTPS
A lock (
) or https:// means you've safely
connected to the .gov website. Share sensitive
information only on official, secure websites.
Distribution of NLR in individual patients with low and high serum d-ROM. Data are presented as upper and lower quartile range (box), median value (horizontal line), and middle 90% distribution (whisker line)