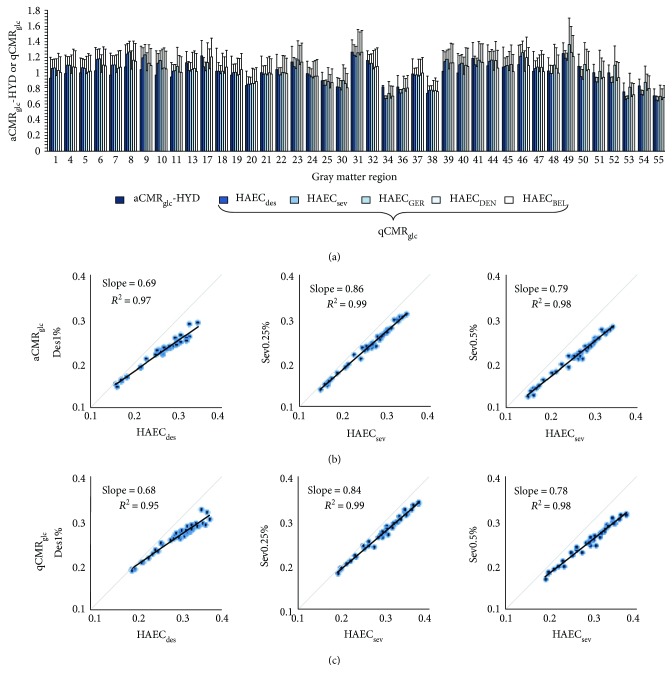
Figure 1.
Validation of quantified CMRglc (qCMRglc). (a) Comparison of absolute CMRglc from Hyder et al. [36] (aCMRglc-HYD) with qCMRglc from five sites for the HAEC condition (Table 1). Bars represent the mean across all subjects in each group for gray matter regions (Table S1), where error bars are one standard deviation. All qCMRglc and aCMRglc-HYD values were very similar both relatively between regions and in terms of mean value, suggesting across-site comparisons are possible with our procedure for quantified CMRglc. The Pearson correlation and the Euclidean distance (Table 2) suggest high similarity and low difference of CMRglc for the HAEC group across all sites. (b) Scatter plots, from left to right, for aCMRglc between Des1%, Sev0.25%, or Sev0.5% groups and equivalent HAEC groups (Table 1). Each point is one gray matter region (Table S1). Slope and R 2 from a linear fit are shown, and units are μmol/g/min, where a slope of less than 1 corresponds to a lower CMRglc in the anesthetized group compared to the control. (c) Same as in (b), except using qCMRglc from each group. The slopes are almost identical in (b) and (c), indicating that the calculation of qCMRglc does not alter the relationship between groups for aCMRglc.

