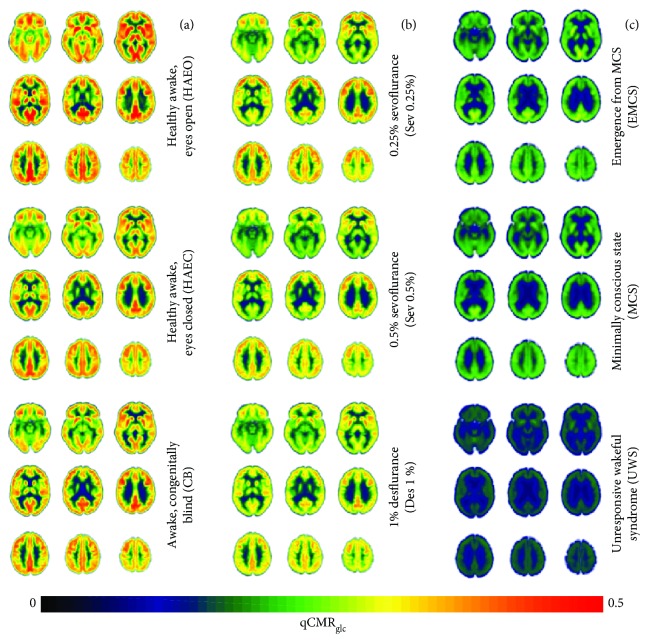
Figure 2.
Quantified CMRglc (qCMRglc) maps of the human brain across nine different states (Table 1), which are (a) healthy awake sighted people with eyes closed (HAEC) or with eyes open (HAEO), as well as healthy awake people who are congenitally blind (CB), (b) healthy people under sedation with gaseous anesthetics (i.e., 0.25% sevoflurane (Sev0.25%), 0.5% sevoflurane (Sev0.5%), and 1% desflurane (Des1%)), and (c) patients with disorders of consciousness (i.e., unresponsive wakefulness syndrome (UWS), minimally conscious state (MCS), and emergence from minimally conscious state (EMCS)). Global increases in qCMRglc were observed proceeding from bottom to top in each column, which is in general agreement with prior PET studies [19, 45–50, 53]. The units are in μmol/g/min. With HAEC as the control condition, all other groups (except the CB group) showed significant global differences in gray matter (Figure S1) and white matter (Figure S2). These and all other images are in the coordinates of the MNI template: left column (from top to bottom) with z values of −15 mm, −12 mm, and −39 mm; middle column (from top to bottom) with z values of −6 mm, −21 mm, and −48 mm; and right column (from top to bottom) with z values of −3 mm, −30 mm, and −57 mm.

