. 2016 Apr 21;7(8):5249–5259. doi: 10.1039/c6sc00595k

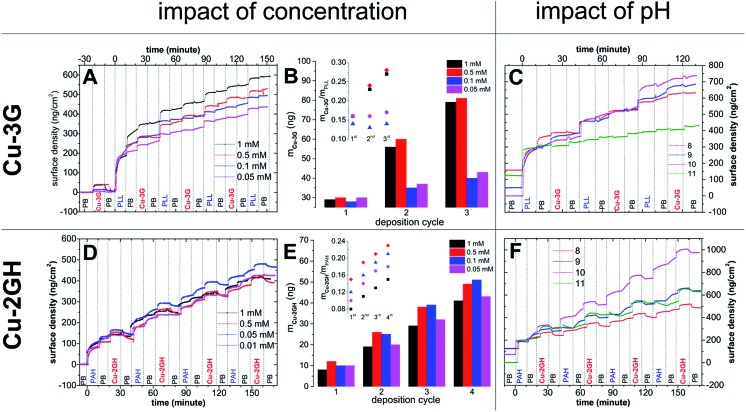
Fig. 1. (A) Variation in surface density (PB, 0.1 M, pH = 7.5) with [Cu-3G] (for concentrations see legend) on ITO coated chip followed by OWLS (vertical grid lines stand for approx. time of injection of the different components as indicated); (B) mass development of Cu-3G (mCu-3G) with the number of LbL cycles (same as in A), inset: mCu-3G normalized with mPLL and plotted against the number of LbL cycles (used for calculating Γ0cat in Table S2); (C) variation in surface density growth ([Cu-3G] = 0.5 mM) with pH (see legend); (D) variation in LbL development of Cu-2GH/PAH with [Cu-2GH] (PB, 0.1 M, pH = 7.5); (E) mass development of Cu-2GH (mCu-2GH) on ITO with the number of LbL cycles (same as in D), inset: mCu-2GH normalized with mPAH and plotted against the number of LbL cycles (used for calculating Γ0cat in Table S2); (F) variation in surface density growth ([Cu-2GH] = 0.5 mM) with pH (as indicated by the legend).

Fig. 1