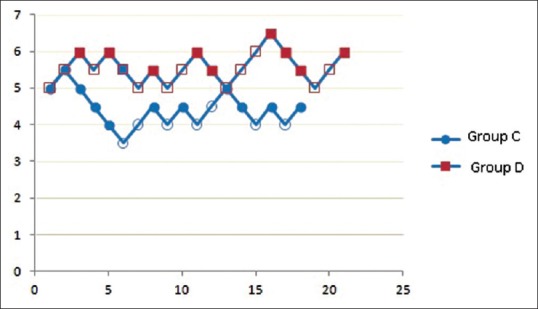
Figure 2.

Sequence of desflurane concentration for maintaining MACBIS50 in both groups. Hollow shape represents average bispectral index value >50, filled shape indicates average bispectral index value <50. X axis denotes number of patients and Y axis denotes concentration of desflurane
