
Figure 3.
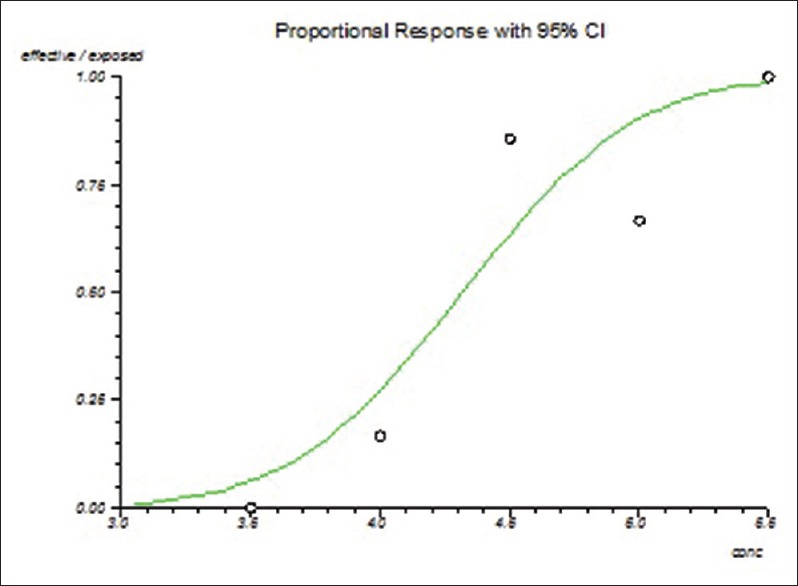
Dose response curve of desflurane for probability of maintaining bispectral index below 50 in Group C; 4.32% (95% confidence interval 3.12–5.08). X axis denotes end tidal desflurane concentration and Y axis denotes probability of bispectral index below 50