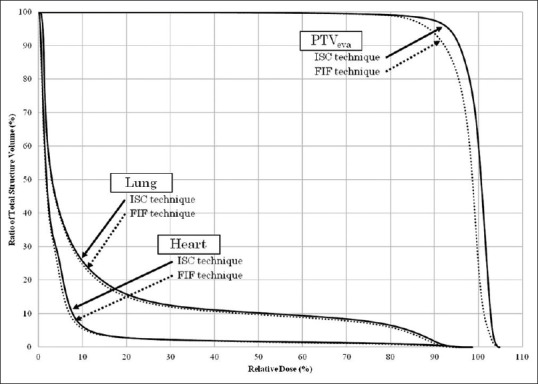
Figure 3.

Dose volume histogram comparing dose distributions for breast cancer treatment between use of the field-in-field and the irregular surface compensator techniques. The same patient was used in Figure 2 and Figure 3. We chose this patient because the breast had a representative volume, and the dose distributions of the field-in-field and irregular surface compensator techniques were close to the average of the 50 patients which Table 1 showed
