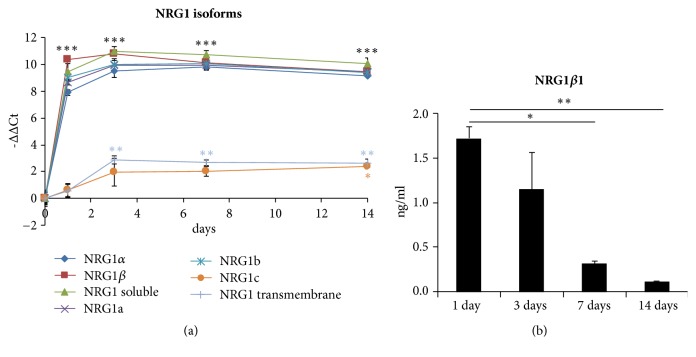
Figure 2.
Degenerating muscle expresses NRG1. (a) qRT-PCR showing the relative quantification (-ΔΔCt = log2fold change) of the different NRG1 isoforms in in vitro degenerating muscle. TBP was used as housekeeping gene to normalize data. (b) ELISA data showing NRG1β1 release in the medium of degenerating muscles. Data are expressed as mean ± SEM. Asterisks denote significant differences between degenerating muscles and the healthy muscle (a) or between the released NRG1 amounts at the different time points (b), ∗p ≤ 0.05, ∗∗p ≤ 0.01, and ∗∗∗p ≤ 0.001.

