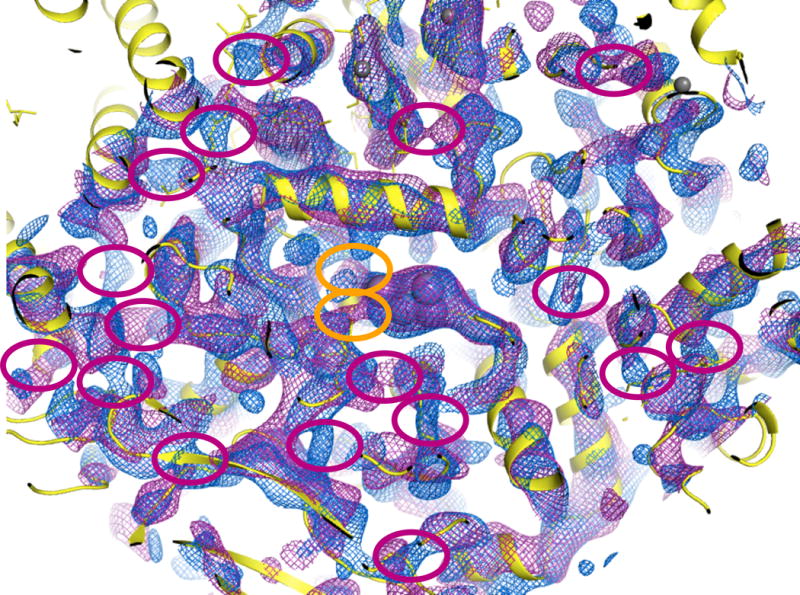
Figure 2.

View of larger area around the OEC in monomer 1, showing phenix.autobuild SA-omit maps contoured at 1.5σ as in Fig. 1b (blue = 4PBU, purple = 4Q54 with corrected monomer assignment as in 4RVY). Orange ellipses: structural differences claimed by Kupitz et al. Red ellipses: additional map differences throughout the structure, showing that the claimed differences at the OEC are within the noise level of these electron density maps.
