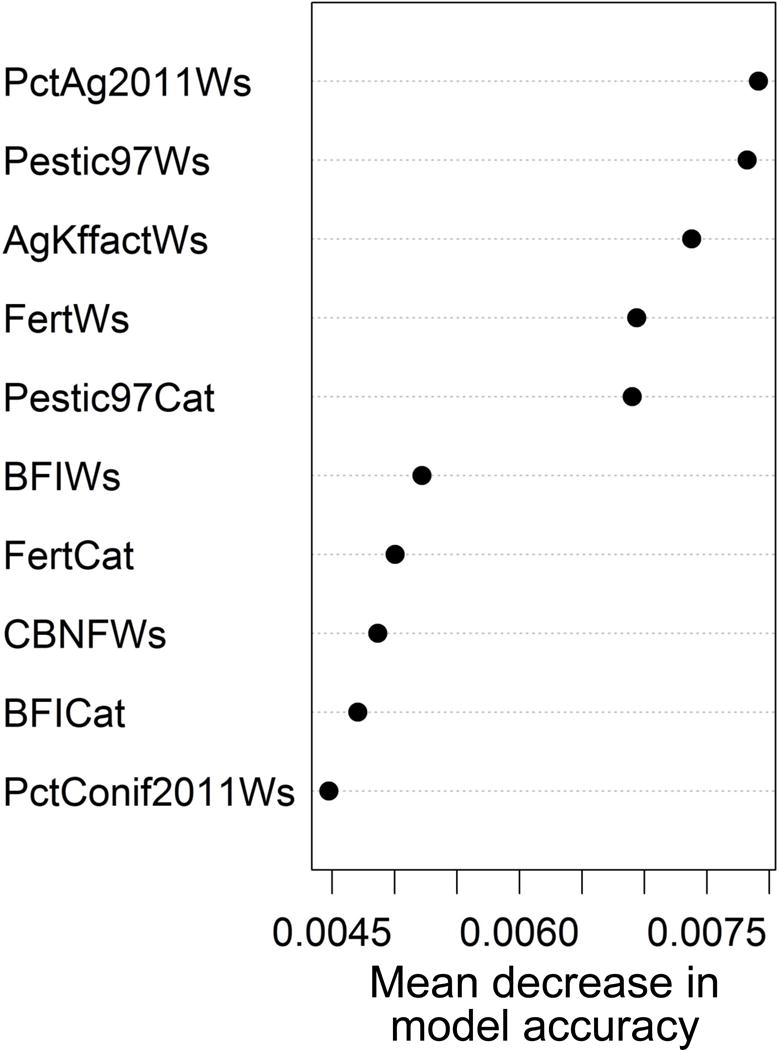
Fig. 7.

Top 10 variables ranked by their importance to the model (mean decrease in model accuracy). PctAg2011Ws = % of the watershed consisting of agriculture (cropland and hay classes of 2011 National Land Cover Dataset); Pestic97Cat and Pestic97Ws = mean 1997 pesticide use (kg/km2) within catchment and watershed, respectively; FertCat and FertWs = mean rate of synthetic N fertilizer application to agricultural land (kg N ha–1 y–1) within catchment and watershed, respectively; AgKffactWs = mean erodibility factor (unitless) of soils on agricultural land within the watershed; BFICat and BFIWs = mean of US Geological Survey base-flow raster within catchment and watershed, respectively; PctConif2011Ws = % of the watershed composed of coniferous forest (2011 NLCD); CBNFWs = mean rate of biological N2 fixation from the cultivation of crops (kg N ha–1 y–1) within the watershed.
