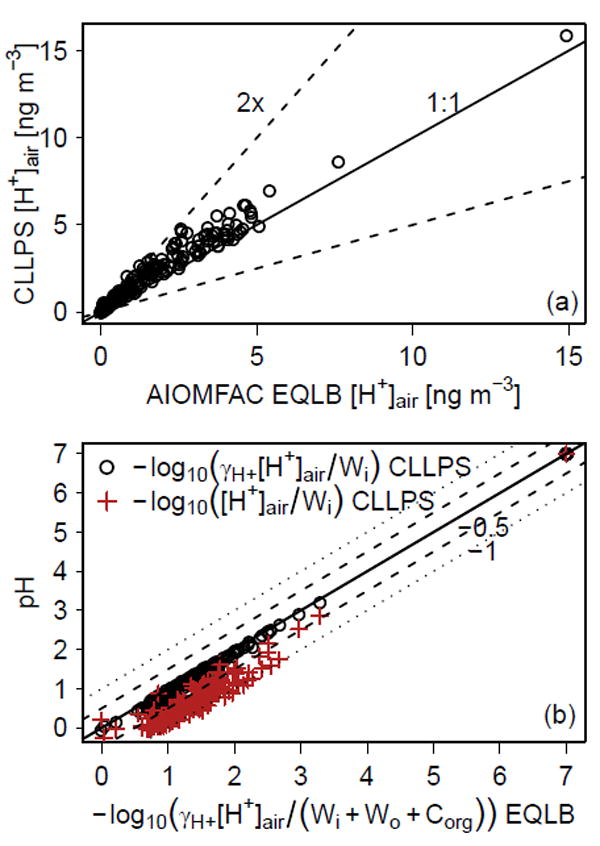
Figure 4.

(a) [H+]air and (b) pH predicted for PM2.5 using AIOMFAC. Dashed lines in (a) indicate a factor of 2 difference from the 1 : 1 line. Dashed lines in (b) represent a ±0:5 shift in pH while dotted lines represent a ±1 shift in pH. Series marked in open circles (○) are summarized in Table 1. All calculations used the ammonium–sodium–sulfate–nitrate–chloride and organic compound system.
