Figure 3.
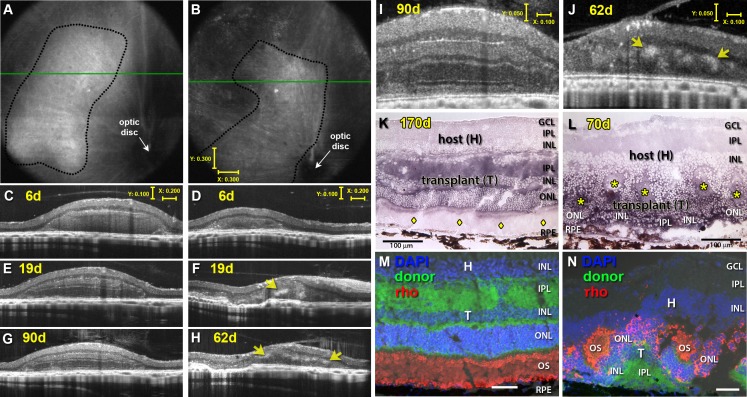
Transplant examples visualized by SD-OCT. (A, B) OCT fundus images and (C–J) OCT cross-sectional B-scans from transplanted RD rats no. 5 and 1 (see Table 1) at 6 (C, D), 19 (E, F), 62 (F, H), and 90 (G, I) days after surgery. Rosettes are indicated by yellow arrows (D, F, H, J) and seen as hyperreflective orbs. (I, J) Stretched B-scans of (G, H) to better distinguish different retinal layers. (K, L) Transplant-specific histochemistry for human placental alkaline phosphatase (hPAP) using BCIP (purple). hPAP is expressed in the cytoplasm (not the nuclei) of donor cells. Two transplant examples are shown. Transplant no. 5 (A, C, E, G, I, K) has a large area of lamination (parallel retinal layers with photoreceptor outer segments, indicated by yellow diamonds (K) and strong rhodopsin expression (M) in the donor outer retina). Transplant no. 1 (B, D, F, H, J, L) is more disorganized with photoreceptors in rosettes (rosette lumens indicated by yellow asterisks in [L]). The rhodopsin-positive outer segments face inward (N). This transplant (L) was partially placed upside down in the subretinal space. (A, B) Scale bars: 300 μm; (C–H) vertical bar: 100 μm; horizontal bar: 200 μm; (I, J) vertical bar: 50 μm; horizontal bar: 200 μm; (K, L): Scale bars: 100 μm; (M, N) Scale bars: 20 μm.

