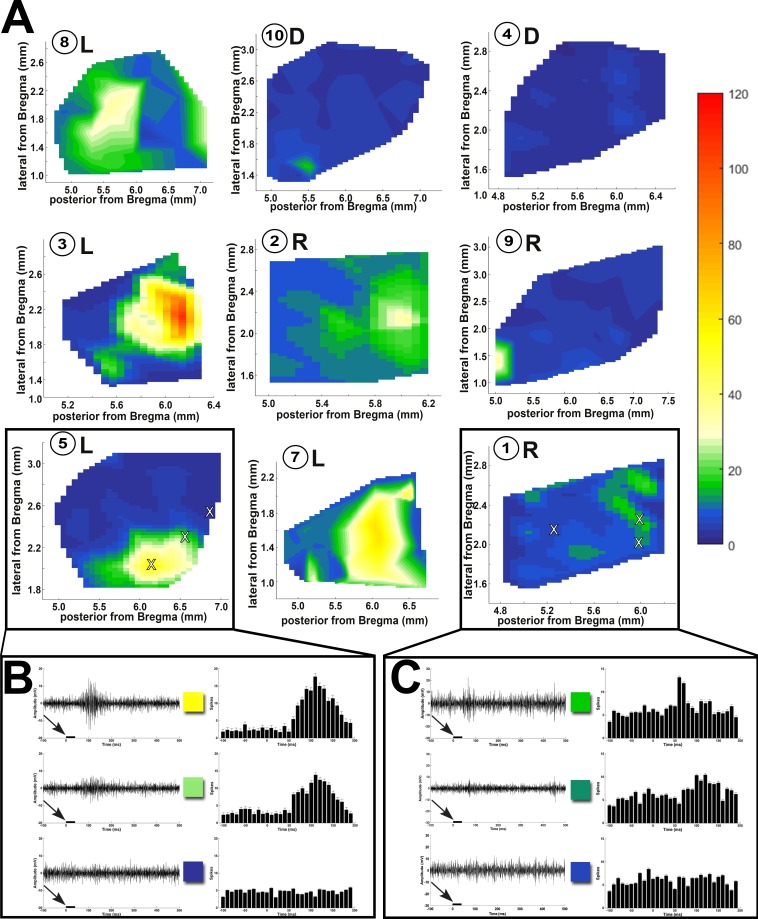
Figure 7.
SC recordings from RD nude rats with retinal sheet transplants. (A) Spike count totals (heat maps) over the entirety of the region recorded in SC for all transplanted rats (the numbers inside the circles are the same rat ID numbers as in Table 1). L: laminated transplant. R: rosettes transplant. D: disorganized transplant. Responses were observed only in certain areas in the SC and were centered on a peak. Sample traces from areas (marked with X) with robust, intermediate, and no response for (B) transplant no. 5 with strong responses and (C) transplant no. 1 with weak responses. Arrows and black bars indicate the light stimulus.

