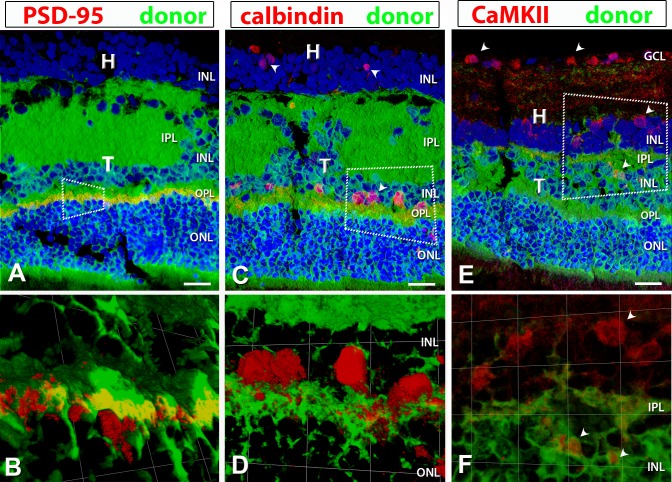
Figure 11.
PSD-95, calbindin, and CaMKII (calcium–calmodulin-dependent protein kinase II) staining (red) in combination with donor label (green). Laminated transplant no. 5 with donor cells labeled green (hPAP) and nuclei labeled blue (DAPI). (B, D, F) were obtained using 3D opacity imaging by enlarging the areas indicated in corresponding boxes within (A, C, E). (A) Immunofluorescence staining with postsynaptic density protein (PSD-95, red: OPL synapses) indicates positive staining only within the transplant OPL. There was no remaining host OPL. (B) With 3D opacity imaging, colocalization of hPAP and PSD-95 was observed. (C, D) Calbindin (red: horizontal and some amacrine cells) labeling in the transplant as well as the host INL indicating development of horizontal and amacrine cells within the transplant. (E, F) CaMKII (red: synaptic layers [GCL, IPL bands, INL, ganglion. and amacrine cells]) antibody labeled IPL bands and ganglion cells within the host IPL and GCL. (E) Labeling of ganglion cells in the host GCL, and displaced ganglion cells or amacrine cells (ACs) within the host INL were observed. CaMKII also labeled what are most likely ACs in the donor INL (arrowheads). (F) Enlargement of area with displaced GCs/ACs in host INL and ACs within the donor INL. Scale bars: 20 μm.

