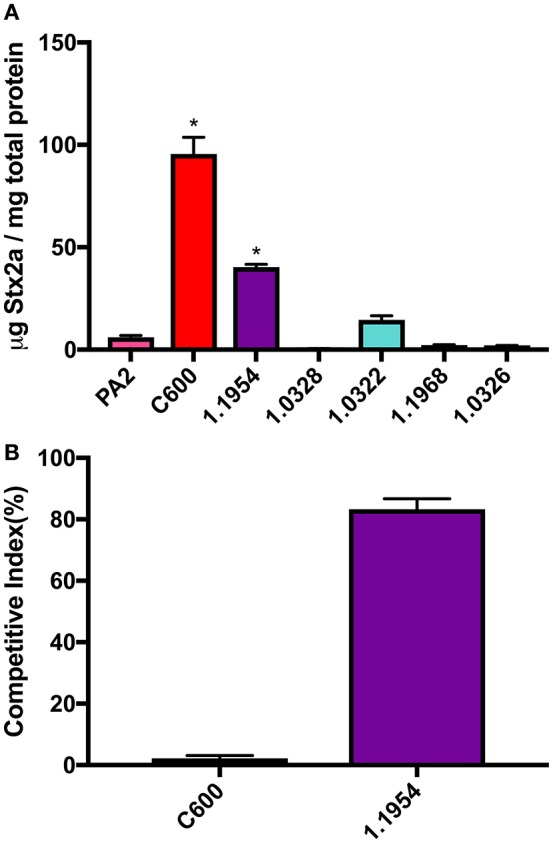
Figure 1.

Stx2a concentration (A) and relative abundance of non-pathogenic E. coli strains (B) after co-culture with E. coli O157:H7 strain PA2. Error bars report standard error of the mean from three biological replicates. One-way ANOVA was used and the Stx2a levels in co-cultures marked with an asterisk were significantly higher than that in PA2 monoculture in pink (Dunnett's test, p < 0.05).
