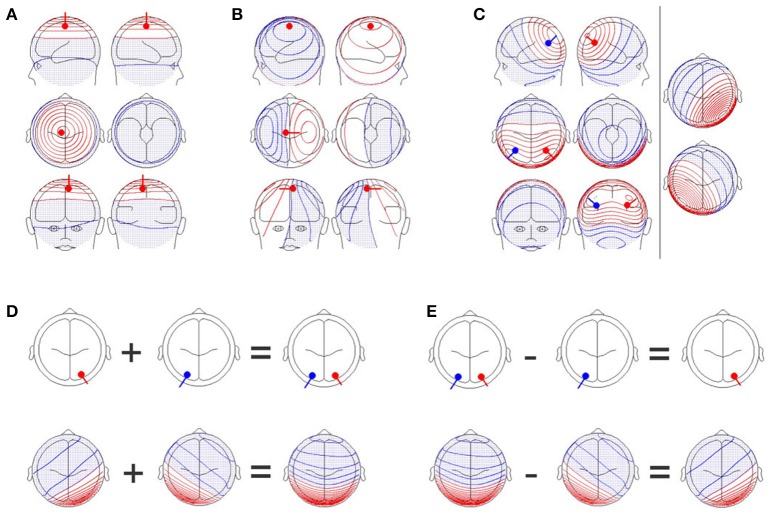
Figure 1.
(A) A single dipole close to the electrode position, Cz, with an orientation perpendicular to the scalp. Upper row: Images of the left (upper left graph) and right (upper right graph) sides of the head. Middle row: Images from the top (middle left graph) and bottom (middle right graph) of the head. Lower row: Images of the front (lower left graph) and back (lower right graph) of the head. Positive values are shown in red while negative values are shown in blue and with dots. (B) A single dipole at the same position as in (A), but the orientation of the dipole has been changed by 90 degrees. The scalp field has drastically changed. (C) Two simultaneously active, symmetrical dipoles in the left and right parietal cortex are simulated. The right section of the figure separately shows the scalp field generated by the red and blue dipoles seen in the left section. The left section also shows the scalp field obtained by combining both dipoles. The resulting scalp field shown on the left is the sum of the two scalp fields shown on the right part of the figure. (D) Additivity and (E) subtractivity of EEG maps. The upper row shows the location of the sources, and the lower row shows the resulting EEG scalp field maps. All graphs were created with the BESA dipole simulator.

