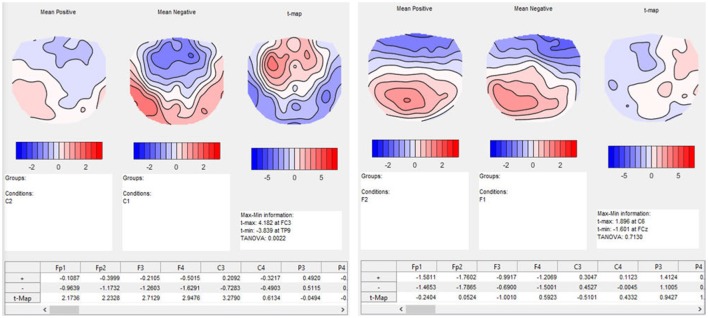
Figure 13.
Results of t-mapping. Left: the ERP mean maps for the expected sentence endings are displayed for day 1 and 2. The resulting t-map is also shown. Day 1 was subtracted from day 2 to parallel the temporal sequence of the conditions, and thus the learning effect. The dialog window also provides further information, including information on the p-value of the TANOVA, and a table with the t-values for each channel. Right: The ERP maps of day 1 and 2, and the corresponding t-map, are shown for the unexpected sentence endings. The t-map for unexpected sentence endings is much flatter than that for the expected sentence endings, and the TANOVA is not significant.

