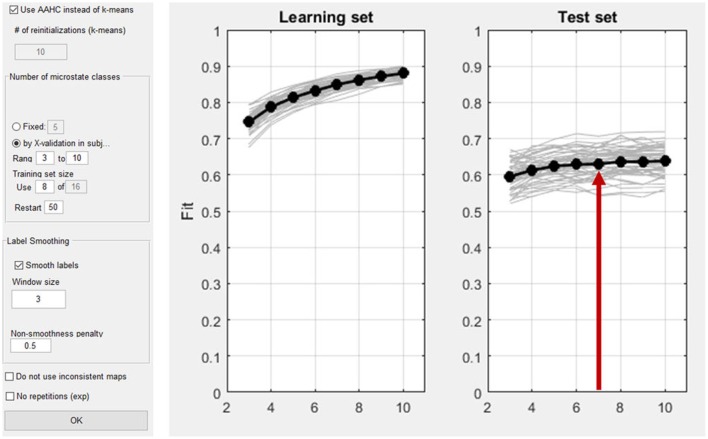
Figure 14.
Left: Dialog window for the computation of microstates in Ragu. Right: The result of the cross validation for the optimization of the number of microstate classes. The x-axis shows the number of classes of the different solutions (3–10). On the y-axis, the explained variance (the fit) is displayed. The left plot shows the explained variance in the learning set, which by nature of the analysis increases monotonically. The left plot shows the explained variance in the test set, which stops increasing after a certain number of microstate classes. The red arrow marks the point in the test set where a plateau of explained variance seems to be reached. The best fitting model seems to be the seven-microstate class solution. However, it may be reasonable to also explore other numbers to ensure that the results do not crucially depend on that particular choice.

