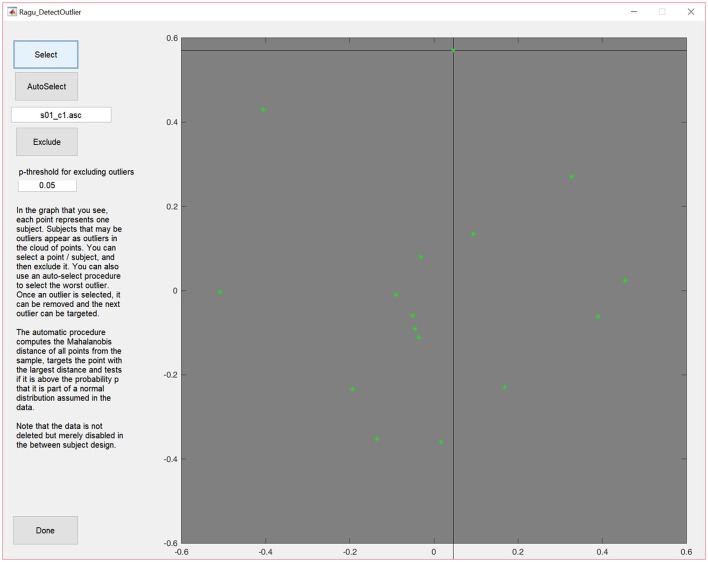
Figure 3.
MDS output of the correlation matrix including data from all subjects. The middle of the graph (value = 0) indicates the mean value of the data across all subjects and conditions. The closer a dot is to the center, the more the data of that particular subject resembles the mean of the data of all the other subjects, and the further a dot is away from the center, the less it resembles the mean of the data from the other subjects. Outliers can be selected and excluded from subsequent analysis.

