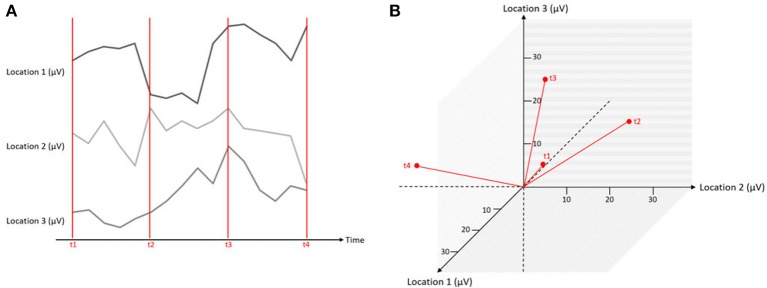
Figure 5.
Simultaneous measurements at three locations expressed in one graphical representation. The red lines mark different time points of measurements (t1–t4), and the black lines indicate the microvolt values at three different channels. On the left (A), the data is displayed as separate traces of each channel. On the right (B), the data is displayed in a state space representation.

