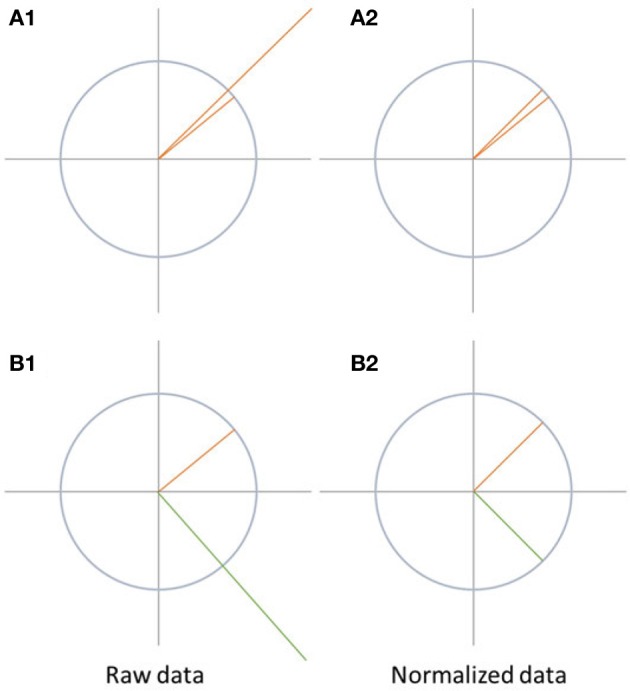
Figure 6.

Visualization of data normalization. On the left side, the raw data is shown while the data after normalization is shown on the right side. The differences between A1 and A2 disappear after normalization. In case of B1 and B2, the differences between the two signals are not only due to difference in the strength of the signal, but also because the state-space vectors have a different orientation. Therefore, the difference between the signals remains after normalization.
