Figure 11.
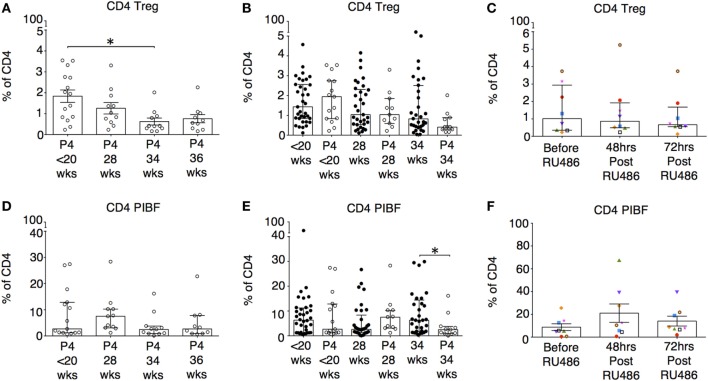
The influence of P4 and RU486 on CD4+ regulatory T cell (Tregs) and P4-induced blocking factor (PIBF) expressing CD4+ T cells. (A) Longitudinal analysis of CD4 Treg proportions (CD4+CD45RO+CD25+CD127lo) in peripheral blood obtained from P4 treated patients. (B) Gestation-matched paired comparisons of Treg proportions in peripheral blood obtained from P4 treated versus untreated pregnant controls that were previously analyzed longitudinally in Figure 3C. (C) Longitudinal analysis of Treg proportions in peripheral blood obtained from RU486 treated pregnant patients. (D) Longitudinal analysis of PIBF expressing CD4 T cells in peripheral blood obtained from P4-treated patients. (E) Gestation matched paired comparisons of PIBF expressing CD4 T cells in peripheral blood obtained from P4 treated versus untreated pregnant controls (Unpaired Mann–Whitney U test). (F) Longitudinal analysis of PIBF expressing CD4 T cells in peripheral blood obtained from RU486-treated pregnant patients. Gestation at sampling is indicated: in pregnant controls (●) at < 20+0 weeks (N = 42), 28 weeks (N = 35), 34 weeks (N = 33); and P4 treated pregnancies (′) at <20+0 weeks (N = 15), 28 weeks (N = 11), 34 weeks (N = 11), 36 weeks (N = 10). For RU486 treated (N = 8) symbols represent individual patients. Longitudinal data were analyzed with either one-way ANOVA with Tukey’s post hoc correction or Freidman test with Dunn’s post hoc correction depending on the data distribution. P values are two tailed and significance is defined as *P < 0.05.

