Figure 2.
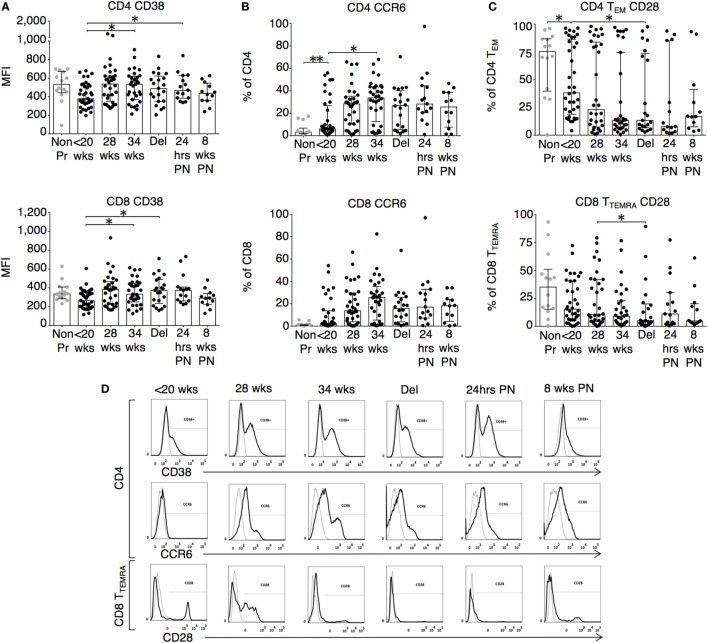
Leukocyte phenotype during pregnancy shows increased activation and migratory potential. (A) CD38 mean fluorescence intensity and the proportion of expression of (B) CCR6 on CD4 and CD8 T cells; (C) CD28 expression on CD4 TEM (CCR7−CD45RA−) and CD8 TTEMRA (CCR7−CD45RA+) T cell subtypes analyzed longitudinally with gestation and compared to controls. Gestation at sampling is indicated in pregnancy (●): <20+0 weeks (N = 42), 28 weeks (N = 35), 34 weeks (N = 33), at delivery (N = 24), 24 h post-delivery (N = 22), 6–8 weeks postnatal (N = 13). Non-pregnant controls are depicted as  (N = 14). P values are two tailed and significance is defined as *P < 0.05 and **P < 0.01. Non-pregnant and baseline pregnant data analyzed by Mann–Whitney U test. Longitudinal data analyzed by generalized linear mixed effects model with gamma log-link and pairwise multiple comparisons of estimated marginal means with sequential Bonferroni correction. (D) Shows representative flow cytometry histograms across gestations with matched isotype controls for CD38 and CCR6 expression on CD4 T cells as well as CD28 expression on CD8 TTEMRA and HLA-DR expression on CD8 T cells.

