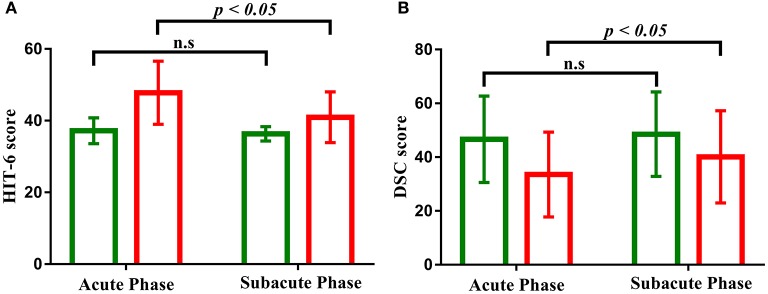
Figure 2.
(A) Bar graph shows the decreased performance of clinical symptom (HIT-6) scales as a function of time (acute phase to subacute phase) with patients with mild TBI (red) but not healthy controls (green). (B) Bar graph shows the increased performance of cognitive function (DSC) scales as a function of time (acute phase to subacute phase) with patients with mild TBI (red) but not healthy controls (green). “n.s” marks p > 0.05, and error bar represents standard deviations of the mean.

