FIGURE 1.
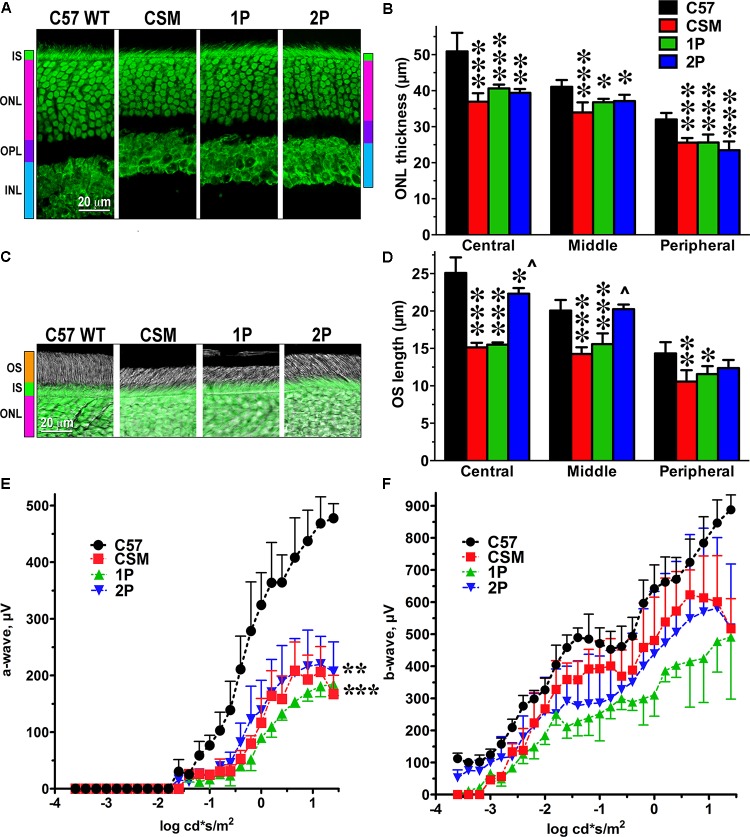
The effect of reduced number of rhodopsin phosphorylation sites on photoreceptor morphology and ERG parameters. (A) Confocal green fluorescent Nissl images of the ONL in central retina sections of 5–6 weeks old mice of indicated genotypes. The positions of the outer segments (OS), inner segments (IS), outer nuclear layer (ONL), outer plexiform layer (OPL), and inner nuclear layer (INL) are shown on the left. (B) The thickness of the ONL (reflecting the number of rod photoreceptors) measured in the Central, Middle, and Peripheral retina were the average of inferior and superior retinal hemispheres. Means ± SE from at least three animals per genotype are shown. The comparison of the thickness of the ONL separately for each retinal subdivision by one-way ANOVA with Genotype as main factor revealed significant effect of Genotype for Central, Middle, and Peripheral retina. ∗p < 0.05; ∗∗p < 0.01; ∗∗∗p < 0.001, as compared to WT C57 mice according to Bonferroni post hoc comparison. (C) Combined DIC and green fluorescent Nissl images of the retina sections of 5–6 weeks old mice of indicated genotypes, enlarged to show OS more clearly. The positions of outer segments (OS), inner segments (IS), and outer nuclear layer (ONL) are shown on the left. (D) The length of the OS measured in the Central, Middle, and Peripheral retina were the average of inferior and superior retinal hemispheres. Means ± SE from three animals per genotype are shown. The length of OS was compared separately for each retinal subdivision by one-way ANOVA with Genotype as main factor, followed by Bonferroni post hoc test. The effect of Genotype was significant in all retinal subdivisions (p < 0.0001). ∗p < 0.05; ∗∗p < 0.01; ∗∗∗p < 0.001, as compared to WT; ∧p < 0.001 to CSM and 2P. (E) Amplitude of the a-wave (reflecting direct response of photoreceptors to light) was lower than in WT in all lines with limited number of phosphorylation sites (two-way ANOVA with Genotype as the main factor and Light Intensity as the repeated measure factor; the Genotype effect was significant: F(3,112) = 20.73; p = 0.0004. The Light Intensity effect was also significant (p < 0.0001) and so was Genotype-Light Intensity interaction [F(28,112) = 13.3; p < 0.0001]. ∗∗p < 0.01; ∗∗∗p < 0.001 to WT across light intensities according to post hoc Bonferroni test. Means ± SE from three animals per genotype are shown. (F) The differences among genotypes in the amplitude of the b-wave, which reflects the response of the bipolar cells driven by both rods and cones, did not reach statistical significance [F(3,192) = 3.23; p = 0.082], but Genotype-Light Intensity interaction was significant [F(48,192) = 1.9; p = 0.0003]. Means ± SD of the data from three mice of each genotype are shown. Means ± SE from three animals per genotype are shown. The data from WT mice were published earlier (Song et al., 2009) and are used here for comparison.

