
Figure 8.
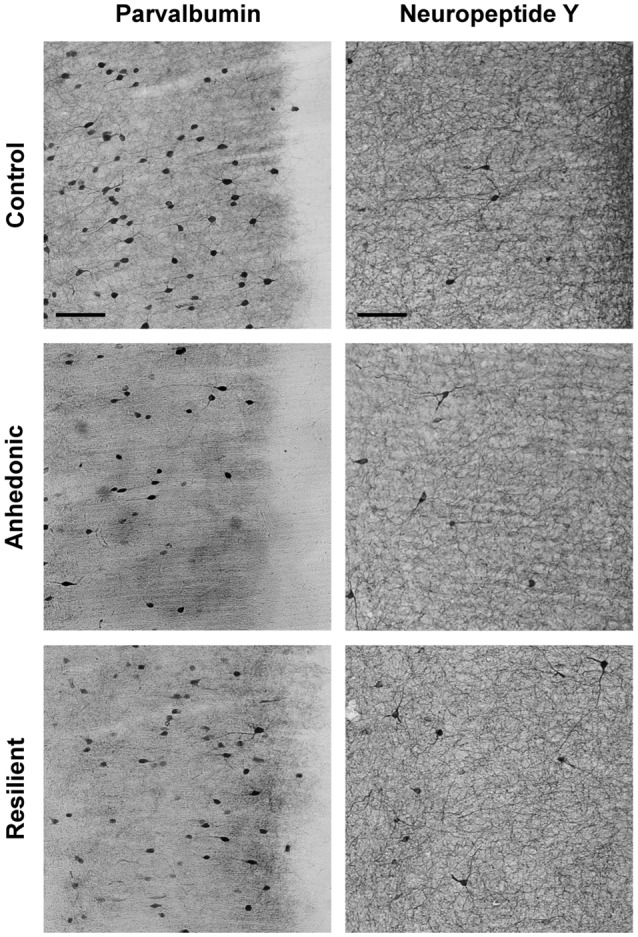
Stress-induced changes in the number of parvalbumin (PV)+ and neuropeptide Y+ (NPY+) neurons in the IL cortex. Representative photomicrographs to demonstrate the differences between the control, anhedonic and stress-resilient animals. The drawing inserted on the top left with the gray square represents the area where the images were taken. Note the lower number of PV+ neurons in the stressed rats, especially in the anhedonic animals. In contrast, NPY+ neurons were more numerous in the stress-resilient rats compared to controls. Scale bar: 100 μm for all images.