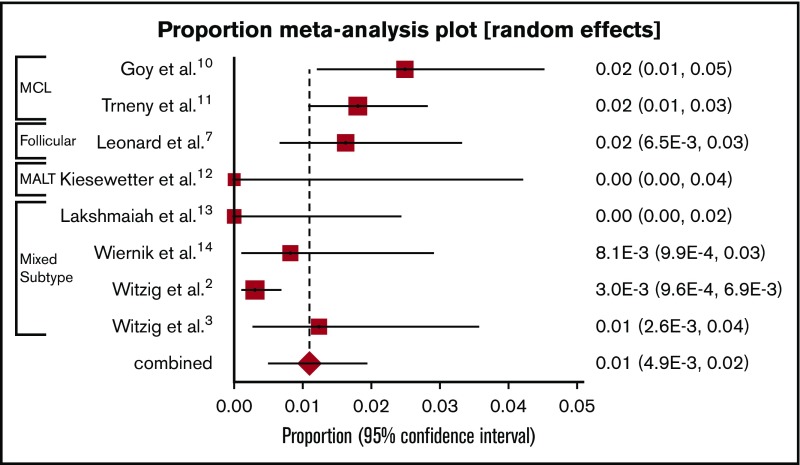
Figure 3.
Forest plot: VTE events per patient cycle for all B-cell NHL patients treated with single-agent lenalidomide. A forest plot representing the proportion of VTE events per patient-cycle for patients receiving single-agent lenalidomide. X-axis, VTE events per patient-cycle. Squares represent proportions for individual studies; diamond represents pooled proportion. MALT, mucosa-associated lymphoid tissue lymphoma.

