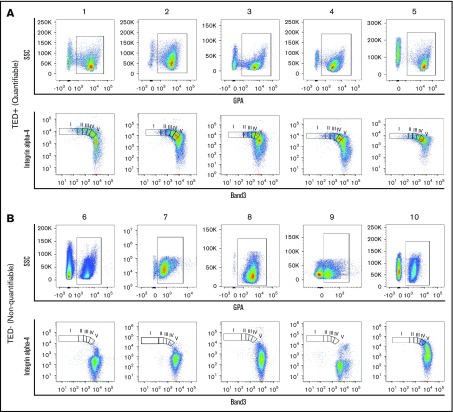
Figure 1.
Flow cytometry profiles of patient samples. Representative dot plots of TED profiles, as observed on flow cytometry, obtained from primary human BM of MDS samples from (A) 5 quantifiable samples and (B) 5 nonquantifiable samples. GPA+ cells (A-B, top) were found in both quantifiable and nonquantifiable samples, but the nonquantifiable samples were characterized by (B, top) low GPA expression and (B, bottom) absence of cells undergoing TED. I, II, III, IV, V, represent pro, EB, LB, poly, ortho stages of TED; SSC, side scatter.

