Figure 2.
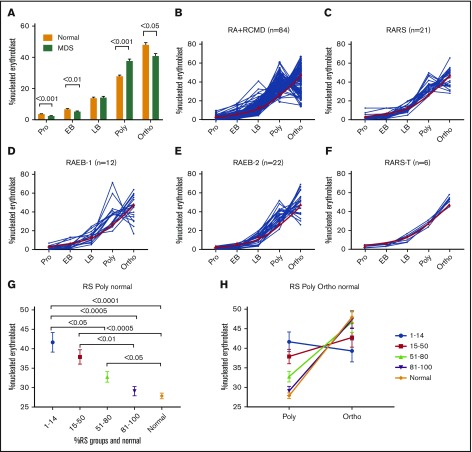
TED is abnormal in patient samples. (A) Bar diagram showing percentage of nucleated erythroid cells in each stage of TED. When compared with normal (n = 16), MDS/MDS-MPN/secondary acute myeloid leukemia samples (n = 95) were characterized by a significant decrease in percentage of cells in pro and EB stages and a significantly abnormal increase of cells in the poly stage, and a decrease in the ortho stage. Data in bar diagram are presented as mean ± standard error of the mean. Each TED stage was compared between normal and MDS samples using unpaired, 2-tailed, nonparametric t test (Mann-Whitney U). (B-F) Line plot showing percentage of cells quantified in each TED stage in individual samples of WHO subgroups. (B) RA and RCMD, (C) RARS, (D) RAEB-1, (E) RAEB-2, and (F) RARS-T. Red line is the mean percentage of cells observed in normal individuals. (G-H) RS subgroups and TED. (G) Pot showing percentage of nucleated erythroblast cells in the poly stage within various RS subgroups and normal samples. There was significant difference in the poly stage between different RS subgroups; less cell arrest was observed in the poly stage as RS increased. All data are presented as mean ± standard error of the mean. Samples were compared using 1-way analysis of variance (Kruskal-Wallis test); multiple comparisons were done using the uncorrected Dunn test. (H) A graph showing inverse relation between poly and ortho stages within various RS groups and normal. Less arrest in poly is translated into more ortho stages. RA, refractory anemia; RS, ring sideroblast.

