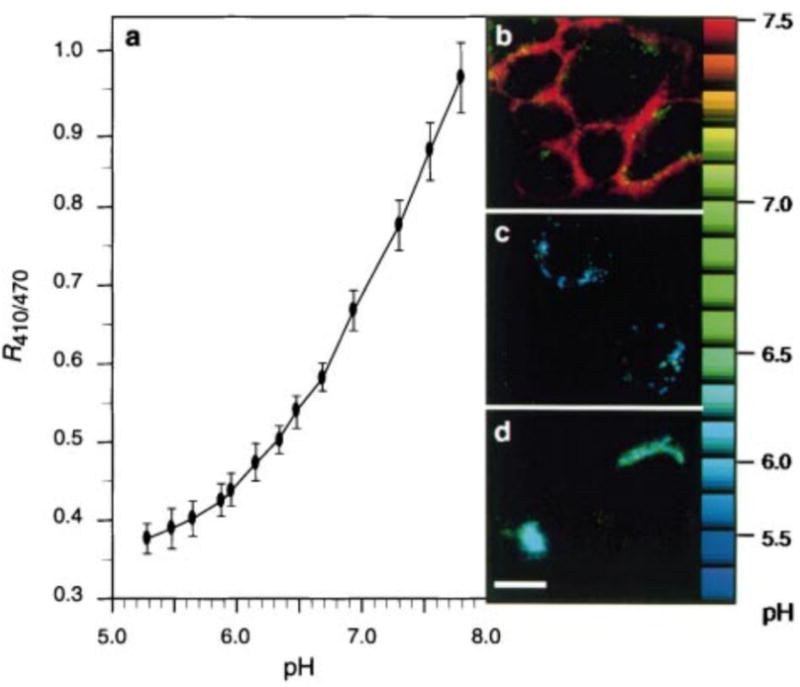
Figure 8.

A pH-sensitive fluorescent protein derived from green fluorescent protein was used as a pH indicator. A) Standard curve for pH measurement created by expressing the fluorescent protein on cell surfaces and culturing the cells in buffers with varying pH. The fluorescent protein was used for pH measurement of cell components by fusing with organelle-targeting proteins including B) glycophosphatidylinositol for cell surfaces, C) cellubrevin for endosomes, and D) TGN38 for the trans-Golgi network. The relative fluorescence localized to the organelles was measured and compared to the standard curve to determine the pH. Scale bar represents 10 μm. Reprinted by permission from Macmillan Publisher Ltd: Nature, Visualizing secretion and synaptic transmission with pH-sensitive green fluorescent proteins, Gero Miesenbock, Dino A. De Angelis, James E. Rothman, 394, 1998, Copyright 1998.
