
Figure 6. cTnI Degradation Following an Acute Elevation in LV Preload.
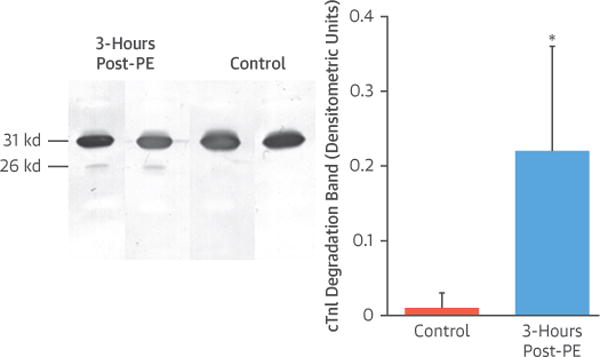
Western Blot images show the presence of a cTnl degradation band (26 kDa) in myocardial tissue collected 3 h after cessation of intravenous PE (left). Densitometric measurements revealed that elevating preload in the absence of ischemia increased cTnI degradation compared with control animals, as indicated by a significant increase in the integrated density of the 26 kDa cTnI degradation band (right). Values are mean ± SD. *p < 0.05 versus control. cTnI = cardiac troponin I; PE = phenylephrine.