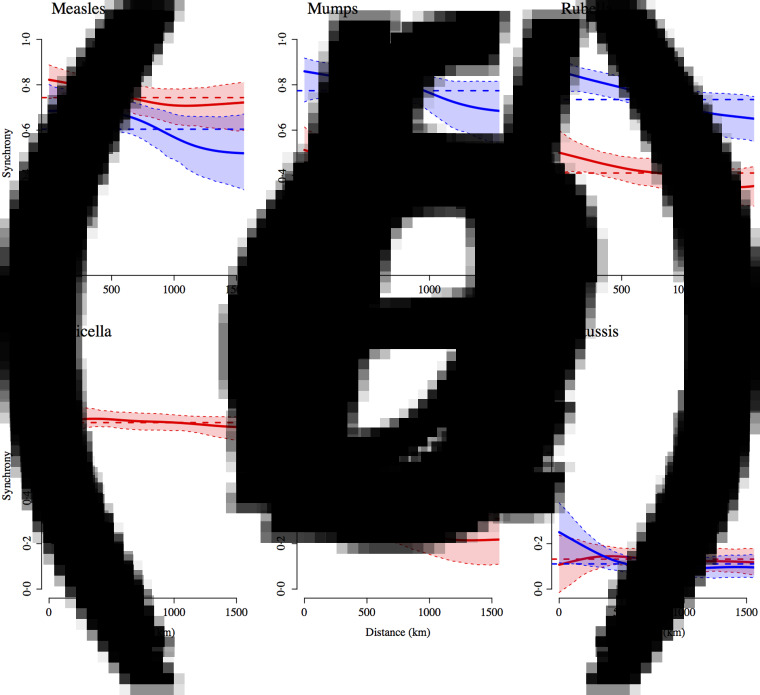
Fig. 8.
Estimated spatial correlation functions showing epidemic synchrony (Pearson correlation coefficient) between states as a function of distance (as measured by the latitude and longitude of the centre of the state) for (a) measles, (b) mumps, (c) rubella, (d) varicella, (e) scarlet fever, and (f) pertussis, along with 95% confidence intervals. Red indicates pre-vaccination and blue indicates post-vaccination era epidemics (1991 onwards for measles and pertussis; 1998 onwards for mumps and rubella). The dashed horizontal line represents the average correlation across all states.

