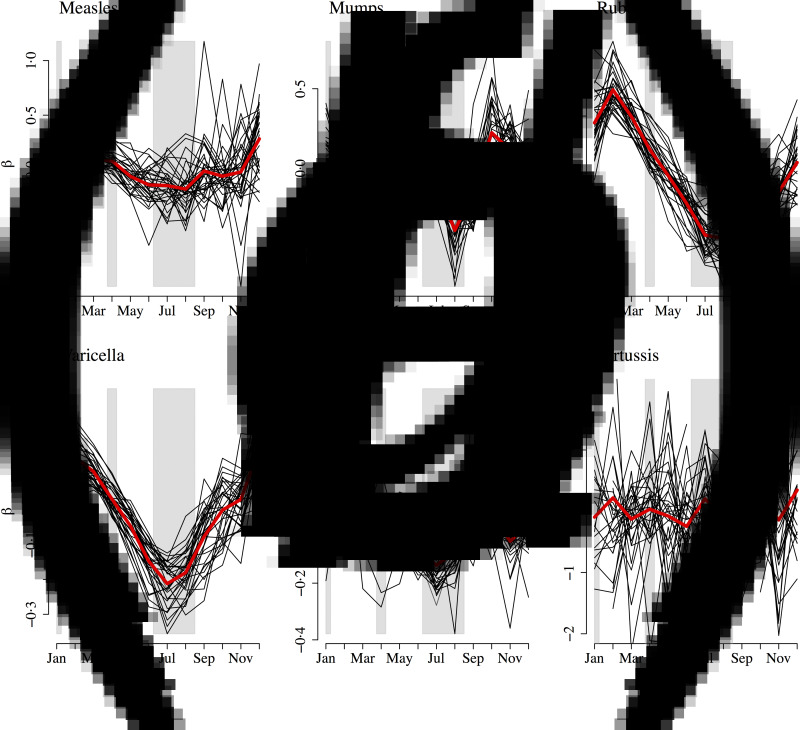
Fig. 9.
Mean centred seasonal transmission coefficients from the time-series susceptible-infected-recovered fit for (a) measles, (b) mumps, (c) rubella, (d) varicella, (e) scarlet fever, and (f) pertussis for each state (black lines). The red line indicates the seasonal transmission coefficient averaged over all states. Approximate school holidays are shown in grey.

